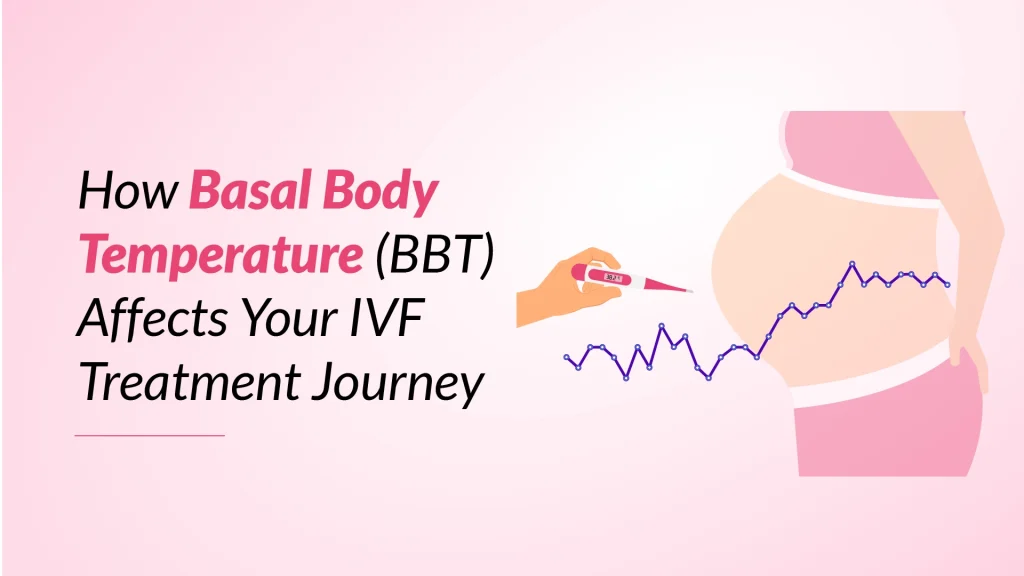
Ideally, all women have usually straightforward and easy-to-read BBT Thermal Shift charts that do show their ovulation patterns very clearly, so everyone could conveniently know exactly when they happen to be fertile. Fertility calculators would have been a thing of the bygone. Unfortunately, this is not really the situation. Each woman is rather different and so is her BBT Thermal Shift chart.
Related Read: 10 Myths Common with Infertility Treatment in Hyderabad
Types of BBT Thermal Shift
1. Biphasic Curve or Standard Thermal Shift Pattern:
There is no such thing as an “abnormal” chart, as some charts do look more typical than others. The most common type happens to be the biphasic curve or standard thermal shift pattern. In the biphasic curve, there are rather 2 phases: a clear set of low temperatures, to be followed by a distinct shift of at least two-tenths (0.2) degrees Fahrenheit’ Another range of higher temperatures that lasts until the end of the cycle. This type of chart is the easiest to read and draws a cover line for you. One can begin to get a sense of whether or not one’s chart is biphasic once one’s temperatures have stayed elevated for at least 3 to 4 days after ovulation, but it is better to wait until the end of one’s menstrual cycle to determine.
Although most women will experience the same kind of patterns within their own cycles, it is indeed rather normal to occasionally see some variation. The biphasic curve is indeed the most common, but there are in fact other types of patterns to keep in mind as well.
2. Slow Rise Pattern:
Another BBT Thermal Shift chart type happens to be the monophasic or slow rise pattern. On monophasic charts, there is, after all, no distinct increase in temperature but there is a gradual rise.
3. Triphasic Curve or Stair-Step Rise Pattern:
The triphasic curve or stair-step rise pattern happens to be a chart in which the temperatures do rise twice after ovulation, thus creating 3 phases on the chart. The initial rise may last for a few days, then the temperatures do rise again for the second time, typically 7 to 10 days after ovulation.
Some women wonder if the second rise actually indicates pregnancy, but there is no scientific evidence that does support that triphasic curves reliably mean pregnancy. The best way to figure out if one is pregnant is to watch for elevated BBT Thermal Shift beyond 14 to 15 days after ovulation without a period.
Related Read: Tips for Pregnancy after Fertility Treatments
4. Fall-Then-Rise Pattern:
In the fall-then-rise pattern, one observes that there happens to be a distinct rise and then temperatures drop or fall slightly again, and then immediately rise again for the rest of the existing cycle. One needs to keep in mind that there are some circumstances where it might indeed be tough to distinguish a fall-then-rise pattern from a chart with a random, outlier temperature.
5. Zig-Zag Pattern:
Judging by the name, temperatures do rise in a pattern that resembles a “zig-zag.” In this pattern, the temperatures may rise, fall slightly, then rise again for a few days.
6. Ovulation Dip (Dip Before Rise):
Some women do tend to observe a slight temperature dip right before ovulation and its subsequent temperature rise. This is, in fact, known as an “ovulation dip.” For those who are lucky and do experience this dip consistently throughout their cycles, it can also serve as a (very) that ovulation will be occurring soon. One also needs to keep in mind that just because one experiences a dip, it does not necessarily mean that ovulation is coming. In other words, it is also possible that one can experience a dip but it is actually not followed by a sustained rise. An individual dip cannot tell one anything about ovulation or one’s fertility treatment in Hyderabad so one needs to make sure that one confirms that ovulation occurred by looking for a subsequent temperature rise.
Related Read: Tips for How to Increase Ovulation Naturally
Find Hope and Solutions for Female Infertility—Explore Our Comprehensive Services
7. Ambiguous Thermal Shift:
Unfortunately, not all thermal shifts are rather clear or obvious. With this kind of pattern, it can indeed be tough to pinpoint when exactly ovulation does occur. Shifts can rather be ambiguous for a number of reasons: temperatures rise slowly; some dips occur, or data could be missing or conflicting.
Suggest Read: Cervical Mucus to Predict Ovulation
8. No Thermal Shift:
Women record BBT Thermal Shift charts with no clear patterns of high and low temperatures even when they are doing all the “DOs” in our “DOs and DON’Ts of BBT Charting.”
It is also possible to have an anovulatory cycle, which will have a thermal shift since there’s no heat-producing progesterone that is released from the corpus luteum. Anovulatory cycles can be temporarily onset by factors, such as illness, stress, or a follicular ovarian cyst. However, multiple anovulatory cycles could be indicative of medical conditions such as Polycystic Ovarian Syndrome. If one suspects that this may be the case, please do reach out to one’s doctor to discuss it further.


 No need to worry, your data is 100% safe with us!